


Head and Shoulders in Technical Analysis
A pattern that belongs to the earliest phases of technical analysis, the head and shoulders reverses both bullish and bearish trends. It is a time-consuming pattern, in the sense that it takes many candlesticks to form all the elements of it, but a powerful one.
Traders love it because it keeps a disciplined approach as it provides all the elements of a good trade: entry, stop loss and take profit. From a money management perspective, it doesn’t offer impressive risk-reward ratios, though. However, the success rate makes it one of the favorite reversal patterns among retail Forex traders and not only.
Head and Shoulders Pattern Explained
Nothing in a bullish or bearish trend seems to indicate the possible formation of a head and shoulders. Instead, the market hesitates for a while, forming a continuation pattern like a triangle or a flag.
That consolidation is called the left shoulder. As the price continues in the direction of the underlying trend, it fails to keep the levels and quickly reverses.
The fast reversal is the one that signals the head and shoulders pattern formation, and it gives its measured move too. Called the head of the pattern, it is a false break as the price comes back and consolidates some more on the right shoulder.
Named after the human body, the pattern has a measured move and a neckline too. While the neckline connects the upper or lower parts of the two shoulders, the measured move is the distance from the head to the neckline, projected from the neckline’s level.
Head and Shoulders in Today’s FX Market
The pattern forms often in today’s currency market. Appearing on all the timeframes, it gives a clue about what the path of least resistance will be.
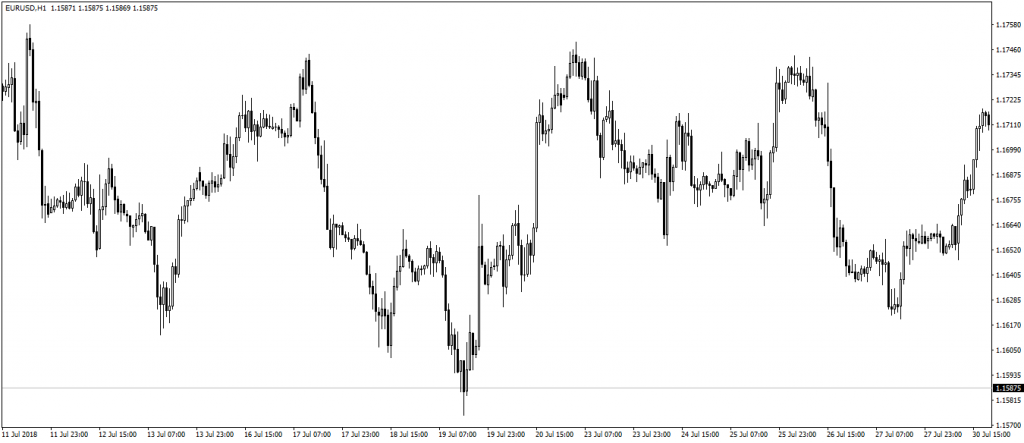
The chart above illustrates the recent EURUSD price action. It illustrates perfectly how the head and shoulders patterns form, primarily how the price consolidates on the left and right shoulders reflecting the currency market’s volatility.
Believe it or not, no less than three head and shoulders patterns exist. Here there are, numbered from left to right:
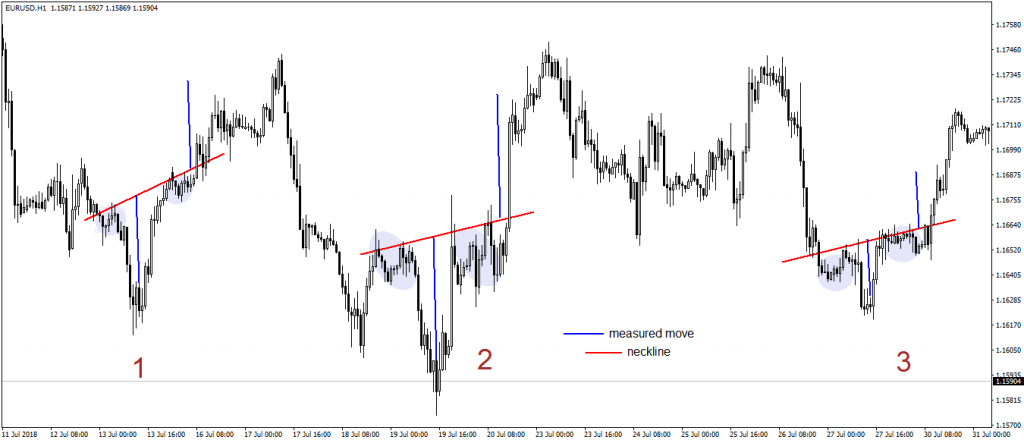
All of them reverse a bearish trend, so the right name for the pattern is “inversed” head and shoulders. The neckline in red isn’t mandatory to be horizontal, as it can have any angle. It contains the price in the two shoulders before the market “going” for the measured move.
Conclusion
The bigger the timeframe is, the stronger the pattern and the implications for the overall market.
What’s certain is that the measured move is only a milestone in the general price action. Traders book half profits when reached, and place the stop-loss at break-even.

