


AUD/USD, USD/CNY down amid China mixed data
The Australian dollar is trading down against the US Dollar as investors reacted to the Chinese GDP mixed data and the drop in the Industrial production. The Yuan is recovering ground against the Greenback.
Chinese gross domestic product rose 1.8% in the Q2, more than the 1.6% increase expected by the market and well above the 1.4% posted at the Q1. Year over year, the GDP in China rose 6.7% between the Q2 in 2017 and 2018, in line with expectations but a slowdown from the Q1 with a 6.8% inter-annual increase.
On the other hand, industrial production rose 6% between May 2017 and 2018. Well below the 6.8% figure of April and a less than the expected growth of 6.5% in the last twelve months to May.
Retail sales in China, however, climbed 9% in June, in line with expectations and more than the 8.5% growth expected by market.
USD/CNY rejected again by the 6.70; is it a double top?
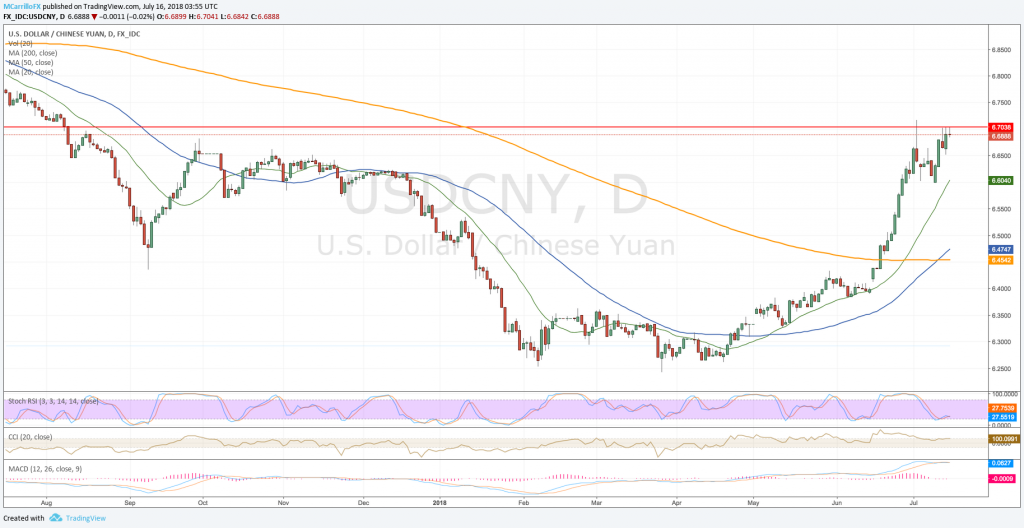
USDCNY Daily chart July 16
As for the forex market, US dollar wasn’t able to break above the 6.70 level against the Chinese Yuan, a critical resistance that has been tested three times in the last week. The USD/CNY is currently trading flat on the day at 6.68.
Technical conditions are suggesting an upside risk in the USD/CNY, but the 6.70 resistance has contained the pair for unclear reasons. In the hourly chart, moving averages are signaling to the upside.
On the big picture, moving averages are turning north but momentum is weak. To the upside, if the USD/CNY breaks above the 6.70 area, it will find next resistance at 6.72, 11-month high.
AUD/USD down post Chinese data, but a recovery is on its way
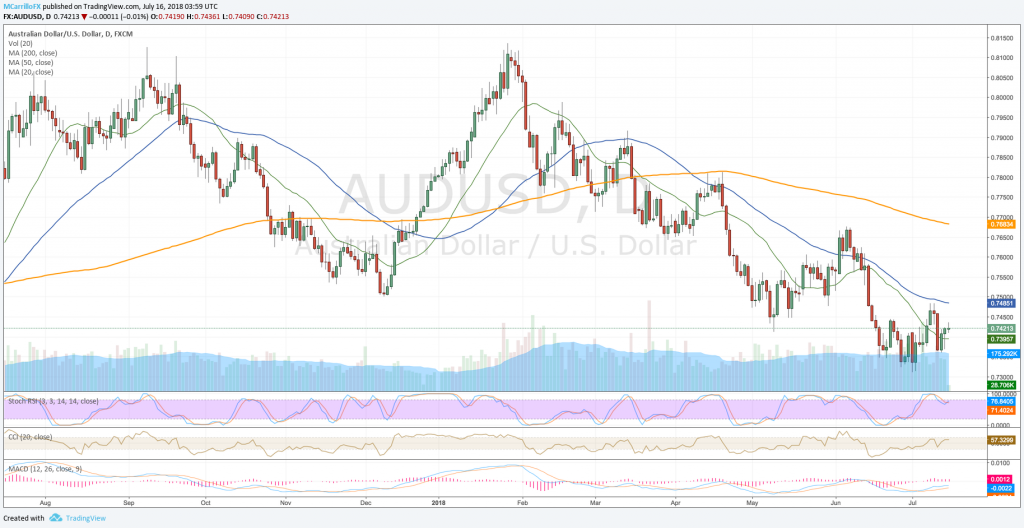
AUDUSD daily chart July 16
The Australian dollar reacted down against the US dollar following a mixed Chinese data. The AUD/USD fell from near 1-week high at 0.7435 to trade as low as 0.7410; however, the pair managed to bounce off lows and it is now back to opening prices.
The AUD/USD is currently trading flat on the session around 0.7422. Technical conditions are mixed on the short term and the big picture. The daily chart shows moving averages aligned to the downside, while momentum is mixed.
