


Bitcoin declines for the sixth day; Ethereum breaks below 400
The crypto king is losing all its previous weeks gains versus the US dollar as investors are taking profits and the Bitcoin finally got the cryptocurrency bearishness.
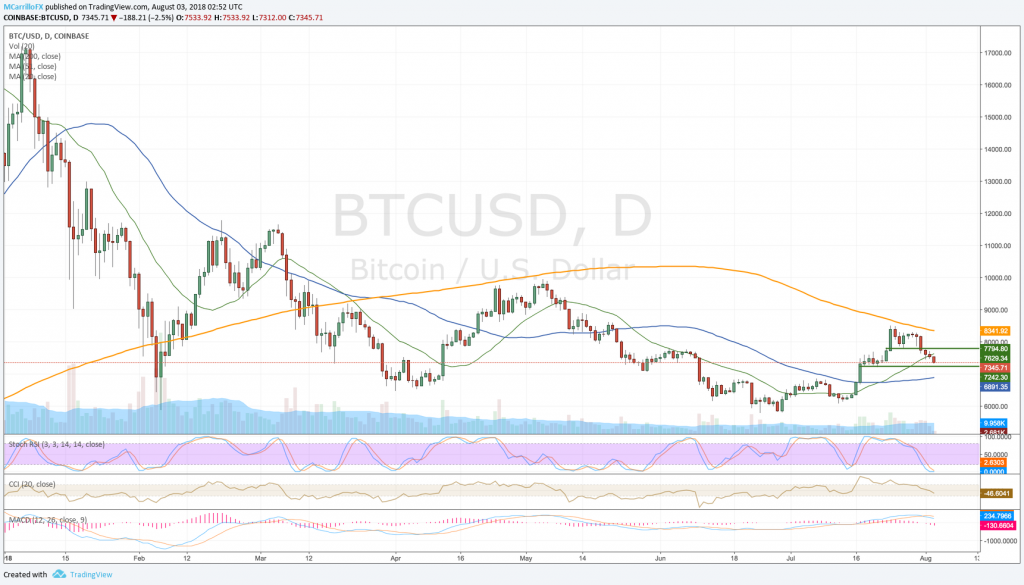
BTCUSD daily chart August 2
Since July 29, the BTC/USD lost over 11%, or $960 in value, from 8,290 to trade as low as 7,320 today. The pair is trading 2.76% down in the day.
The 200-day moving average at 8,340 is now containing the pair. Technically, the unit is pointing to the south with the MACD crossing lines down and the RSI signaling weakness.
With the pair below the 20-day moving average, the BTC/USD is now ready to test the critical support at 7,240. Below there, the unit will find supports at the 50-day moving average at 6,890, the 6,830, and the 6,170.
To the upside, the pair needs a close above the 7,795 area to spurs bulls for more purchases. Above that, check for the 8,250 level, the 200-day moving average at 8,340, and the 8,500 area.
Ethereum below 400.00; near 4-month lows
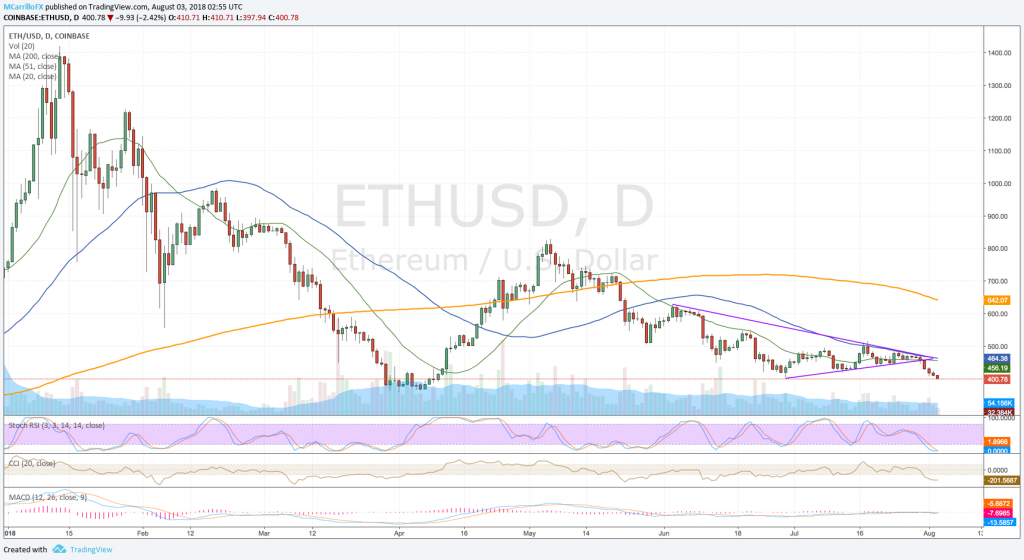
ETHUSD Daily chart August 2
Ethereum, the second cryptocurrency by market value, is trading down for the seventh day in a row as the pair has lost over 15% in value from 470 on July 28 to price as low as 397.95 on Friday.
After two days of flirting with the the 404.00 support, the pair broke it, and now it is trading at its lowest level since April 10. Now, ETH/USD doesn’t have significant levels before the 2018 low around 360.00.
Technically, the pair remains distinctly bearish with all indicators pointing to the south including moving average. The real test comes now at 360.00, Below there, check for the 340.00, 300.00 and 280 as possible buying zones.
