


Bitcoin is negative for ten days in the last eleven, and more to come
Bitcoin nightmare has no end as the BTC/USD is performing on Wednesday its tenth negative day in the last eleven as the pair is now trading at 6,570, its lowest level since July 16.
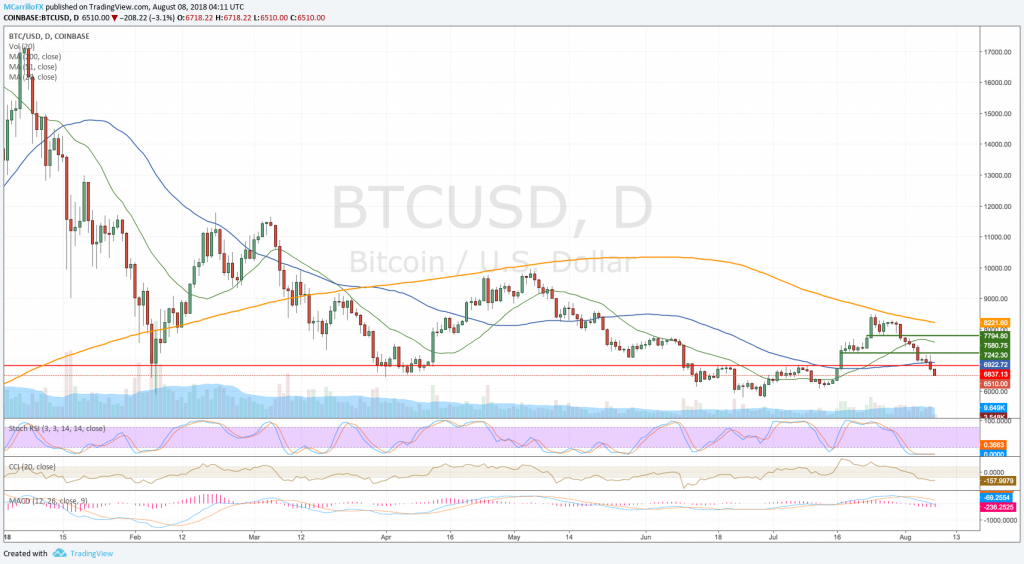
BTC/USD daily chart August 8
Since July 29, BTC/USD has lost near 21% of its value from 8,289, to trade as low as 6,528. IN its journey, Bitcoin has broken several technical levels including 7,795, broken on July 31, the 7,242 on August 4, the 50-day moving average at 6,920 and the 6,837 ops August 7.
BTC/USD is currently trading 3.7% negative at 6,465 on Wednesday as SEC’s decision to postpone its verdict about VanEck first bitcoin-related exchange-traded fund until September 30 worsened market sentiments. The decision was scheduled to be announced on August 10.
“Accordingly, the Commission, pursuant to Section 19(b)(2) of the Act,6 designates September 30, 2018, as the date by which the Commission shall either approve or disapprove, or institute proceedings to determine whether to disapprove, the proposed rule change (File No. SRCboeBZX-2018-040),” the official release said.
Back on the cryptocurrency chart, Bitcoin picture is clearly bearish. Almost comatose. All indicators are more than bearish, and moving averages are pointing to the downside.
With the pair below the 6,500, BTC/USD will find next supports at 6,130 and 6,000. Below there, pay attention to the critical 5,800 area, 2018 low.
To the upside, the pair needs medical assistance, but in the case it takes over the 6,800 area, BTC/USD needs a close above the 50-day moving average at 6,920. Above there, check for 7,240, 7,795 and the 200-day moving average at 8,220.

