


Bitcoin lost the battle against its 200-day moving average
Bitcoin is trading down against the US dollar for the second day as bulls were unable to push the BTC/USD above the 200-day moving average.
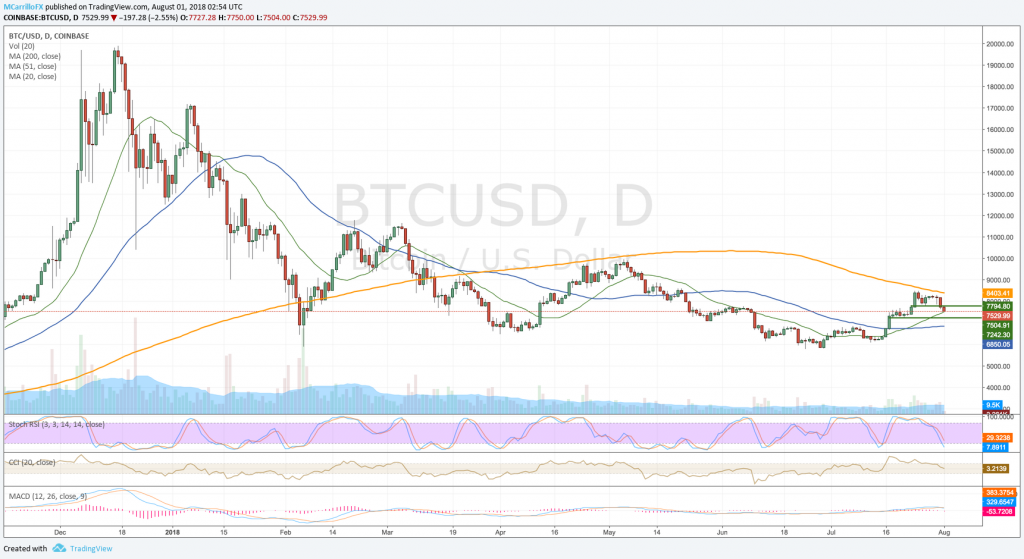
BTCUSD daily chart July 31
Bitcoin is now trading 2.7% down in the day at 7,520. Fourth negative day in a row.
It was clean and neat, the 200-day moving average, now at 8,403.50, contained the BTC/USD upside since July 24 until the pair gave up on Tuesday. Even worse, the 8,250 rejection launched the cross to break below the 7,795 support, and it is now testing the 20-day moving average at 7,505.
Bitcoin has turned bearish in the last few days, and technical conditions are now pointing to the south. MACD performed a bearish break and RSI is showing more bearishness is possible.
However, FXStreet analyst Yohay Elam weights the BTC/USD retracement. Elam says that a few notable levels are moving higher, “so, recapturing $8,000 is not that hard. Moving beyond the round number can take more time.”
Elam states that “the line in the sand for Bitcoin is $7,524 which consists of the potent mix of the Pivot Point one-week S1 and the PP one-month R1.”
To the downside, immediate support is the 7,242 level. Below there, 50-day moving average at 6,850, and mid-July lows at 6,140. Critical support is at 5,795.
Ethereum consolidates triangle break. Dovishness is the picture
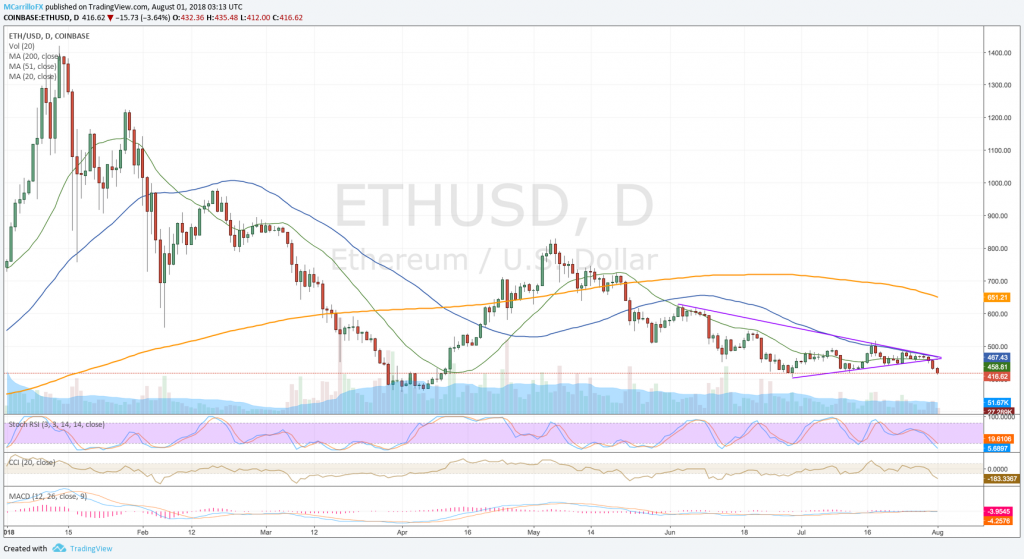
ETHUSD daily chart July 31
Ethereum is trading negative for the fifth day in a row. Today, ETH/USD is 3.7% down at 416.35. Since July 28, the pair lost 12% value.
ETH/USD is now trading 1-month lows around 412.00 as the pair broke the symmetrical triangle on June 30.
Technical conditions show that moving averages are signaling for more dovishness; while MACD is neutral, but RSI is hinting more weakness.
