


Bitcoin on a flag formation; moving average crossing on the way
Bitcoin is trading positive for the eighth day in a nine as investors are waiting for a new catalyst to buy more cryptocurrencies.
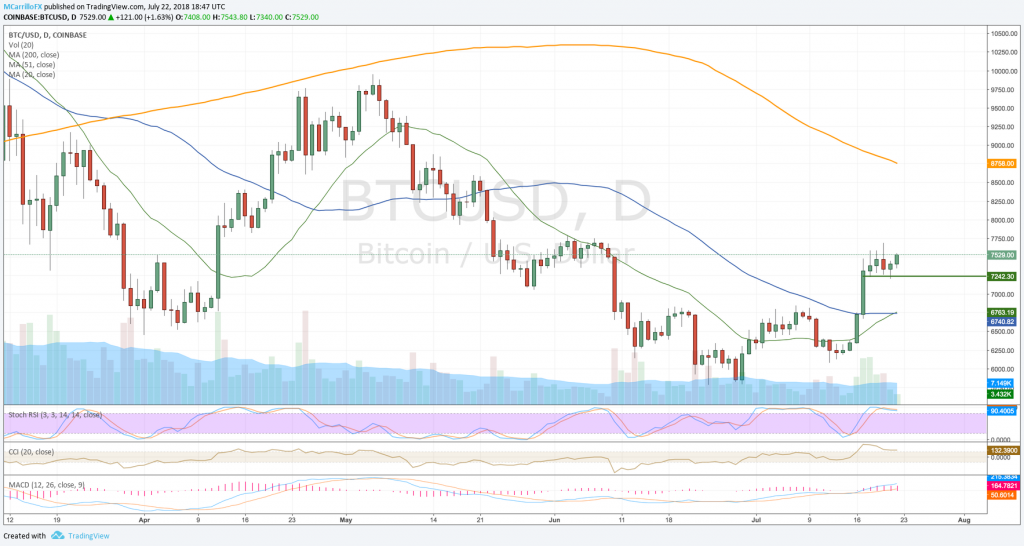
BTCUSD daily chart July 22
BTC/USD rallied from 6,200 to 7,500 between July 16 and 17 before starting a consolidation phase between 7,250 and 7,580. The complete movement is inside a flag formation from July 14 until the current session.
Today, Bitcoin is trading 1.56% positive on the day at 7,523. The pair seems to be ready to attack new highs above the 7,750.
Technical conditions are bullish with a chartist event happening right now as the 20-day moving average is crossing above the 50-day MA, which is considered as a bullish event. On the dark side, the 200-day moving average is still pointing to the downside.
To the upside, the pair should maintain prices above the 7,240 level to build a new leg for further hight. Next resistances are at 7,560 and 7,750. Above, check for the 8,000 level as a critical selling area.
To the downside, the pair needs a break below the 7,240 before confirming a short-term trend change. Next supports are a critical level at 6,850, then 6,150 and 5,790.
Ethereum finds support at 440.00
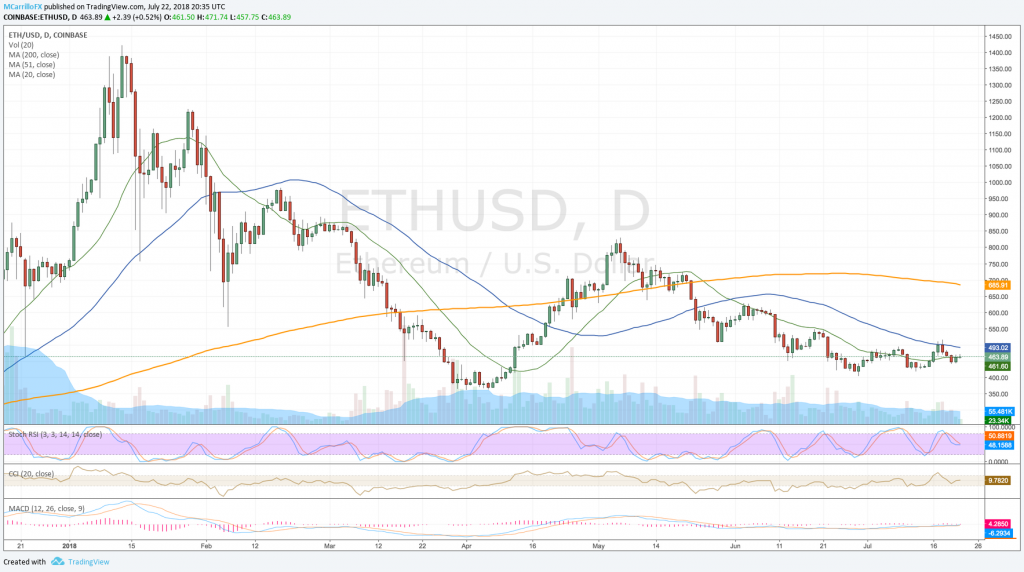
ETHUSD Daily chart July 22
Ethereum stopped its 3-day decline against the US Dollar from 516.00 at 442.15 on July 20 as the pair is now trading positive for the second day at 463.00. ETH/USD is trading attached at the 20-day moving average.
ETH/USD is currently trading 0.32% positive on the day at 463.00. Technical conditions are mixed, but moving averages are neutral to the downside. The 50-day moving average is containing the upside. ´
For the bulls, the ETH/USD needs a close above the 50-day moving average at 493.00 to give hopes to bulls. Above that, next resistances are at 520.00 and 560.00. Then, 640.00 and the 200-day moving average at 685.00 is the last frontier.
For the bears, the cryptocurrency needs a break below the 440.00 to start believing in a resuming downtrend. Below that, 415.00 and 400.00 are the prices to check. Finally, 360.00 is the ultimate support.
