


Bitcoin trades lower and tests the 50-day moving average
Bitcoin is trading lower against the US dollar as the pair is extending its rejection from the 8,500 area on July 25 to test the 50-day moving average at 6,910.
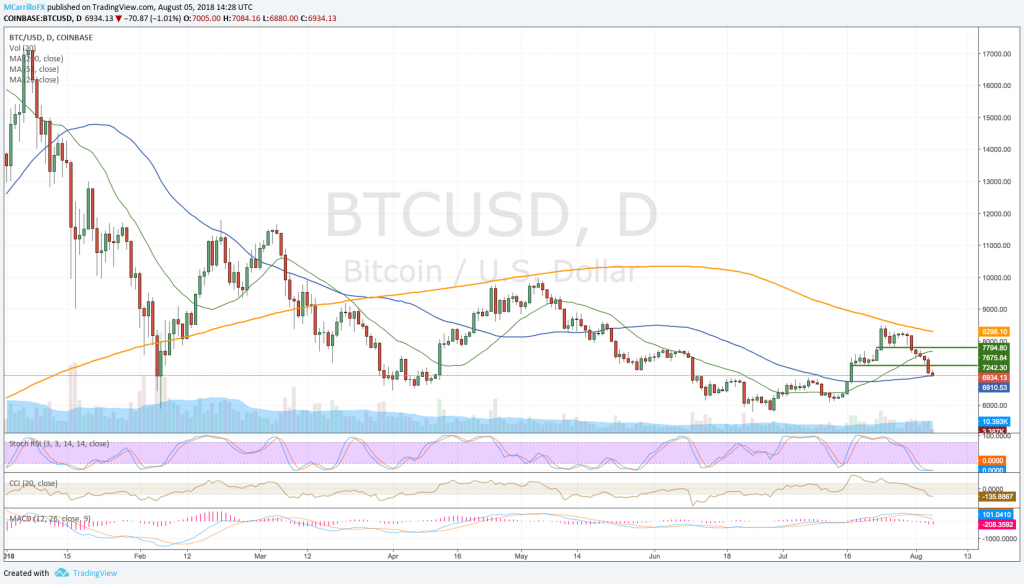
BTCUSD daily chart August 5
The crypto king is currently trading 1.26% negative on the day at 6,907 as the pair is falling for its eighth consecutive day.
The chart is showing that the 200-day moving average is containing the pair since its break on March 14. Previous performances suggest that the should go below June’s lows around 5,800.
Technically, the pair is oversold, and indicators are pointing for further losses. MACD is aligned to the downside, while the RSI is showing weakness for the pair. BTC/USD is currently moving between 200 and 50 days moving averages.
If the cross breaks below the 50-day moving average at 6,910, immediate support is at 6,830. Below there, check buying zones at 6,150 and 5,800.
To the upside, The pair needs to hold the 6,910 level and build up a sense of support. Immediate resistance is at 7,240, then 7,800. Above there, check for the 200-day moving average at 8,300 and July 24 high at 8,488.
Goldman Sachs sees “further declines”
“Our view that cryptocurrencies would not retain value in their current incarnation remains intact and, in fact, has been borne out much sooner than we expected,” Goldman Sachs analyst Sharmin Mossavar-Rahmani said.
In its mid-year report, Goldman Sachs criticized cryptocurrencies and said they are expecting more declined. “We expect further declines in the future given our view that these cryptocurrencies do not fulfill any of the three traditional roles of a currency: They are neither a medium of exchange, nor a unit of measurement, nor a store of value.”

