


Forex Opening: Dollar on the defensive after France says Europe would retaliate
The French government said the United States should expect united retaliation from Europe in case of further tariff increases from Washington. On the other hand, Germany signaled it is willing to negotiate.
French Finance Minister Bruno Le Maire said: “if tomorrow there is an increase in tariffs, like in the car industry, our reaction should be united and strong to show that Europe is a united and sovereign power.”
In an economic conference in Aix-en-Provence, southern France, Le Maire stated that “the question is no longer whether or not there will be a trade war, the war has already started.”
EUR/USD opens positive; just above 50-day moving average
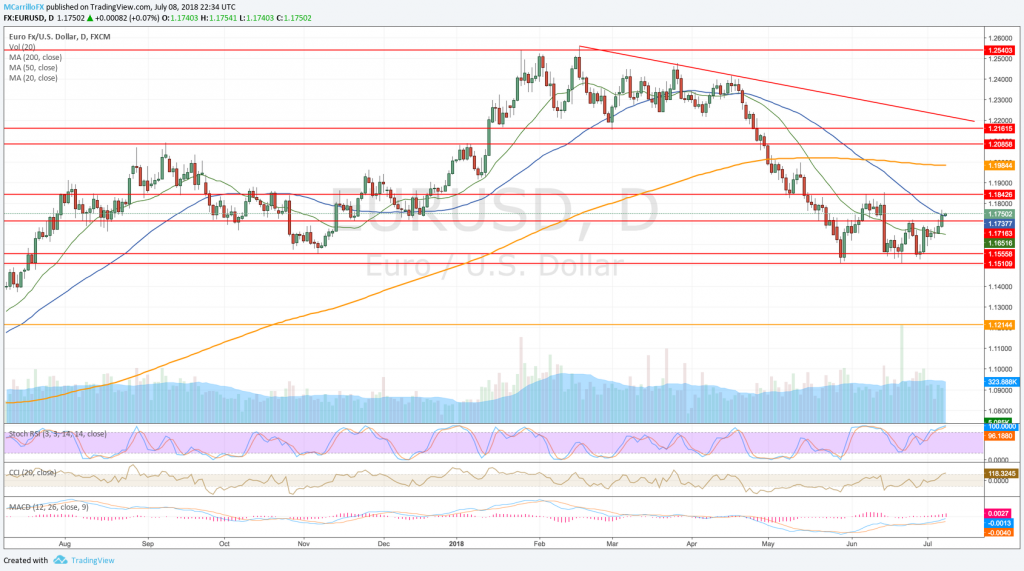
EURUSD daily chart July 9
The euro opened the week at 1.1750, 0.07% positive against the dollar on Monday. EUR/USD is trading just above the 50-day moving average
The EUR/USD is trading inside a clear uptrend from 1.1510 that was confirmed after the breaking of the 1.1715 performed on Friday. The pair is overbought, but momentum is confirming the upside potential.
If the pair confirms the opening above the 50-day moving average, it will find next resistances at 1.1800, first, and then the double top at 1.1840. Above that, the 200-day moving average at 1.1958.
GBP/USD jumps to 1.3315, July highs after opening with a gap
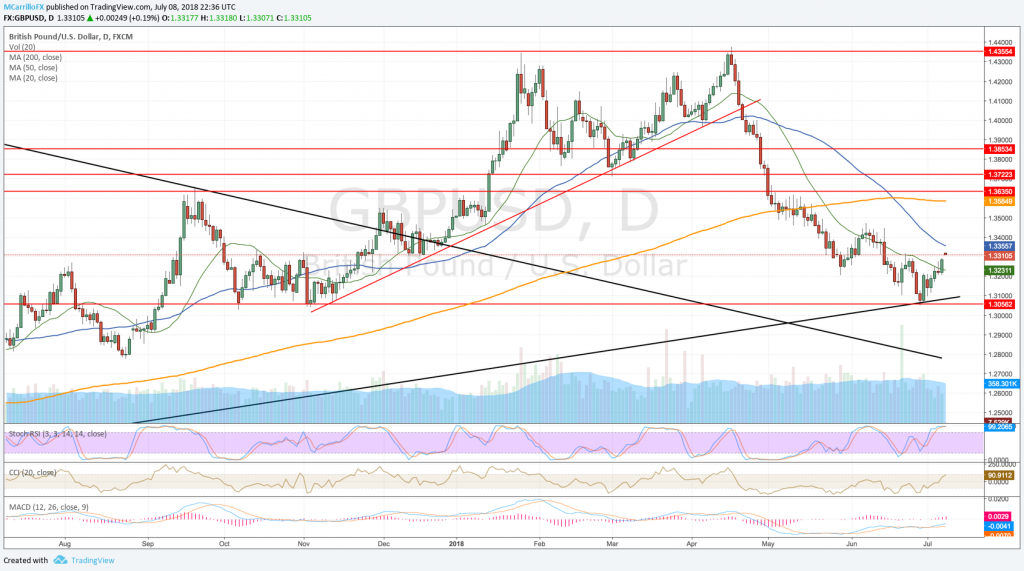
GBPUSD daily chart July 9
The British Pound is performing an opening gap versus the US Dollar as the GBP/USD started the week above the 1.3300 level for the first time since June 14.
Cable is trading 0.20% positive in the day at 1.3310 after breaking June 22 high of 1.3315. Would does the GBP/USD keep the gap? It doesn’t happen usually and the unit should fill the gap. However, time will say.
As for the upside, GBP/USD looks overbought but momentum is confirming the upside potential. The pair is trading in recovery mode following a bounce performed on June 28 at 1.3050.
If the pair consolidates gains, next resistance would be the 50-day moving average at 1.3350, then June 7 high at 1.3470.
USD/JPY down, testing 20-day moving average
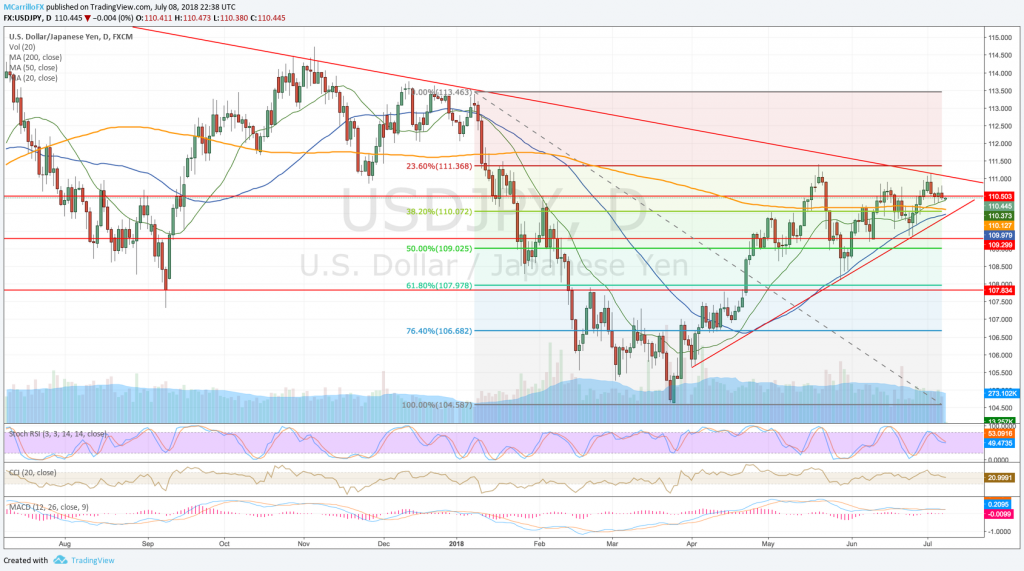
USDJPY Daily chart July 9
US dollar is holding positions against the Japanese yen thanks to the 20-day moving average at 110.45. However, the pair looks weak and it seems a matter of time for the USD/JPY to break levels down.
USD/JPY is trading in an asymmetrical triangle with a confluence of neutral moving averages. Stay focus and wait.
AUD/USD opens positive, ready to post more gains
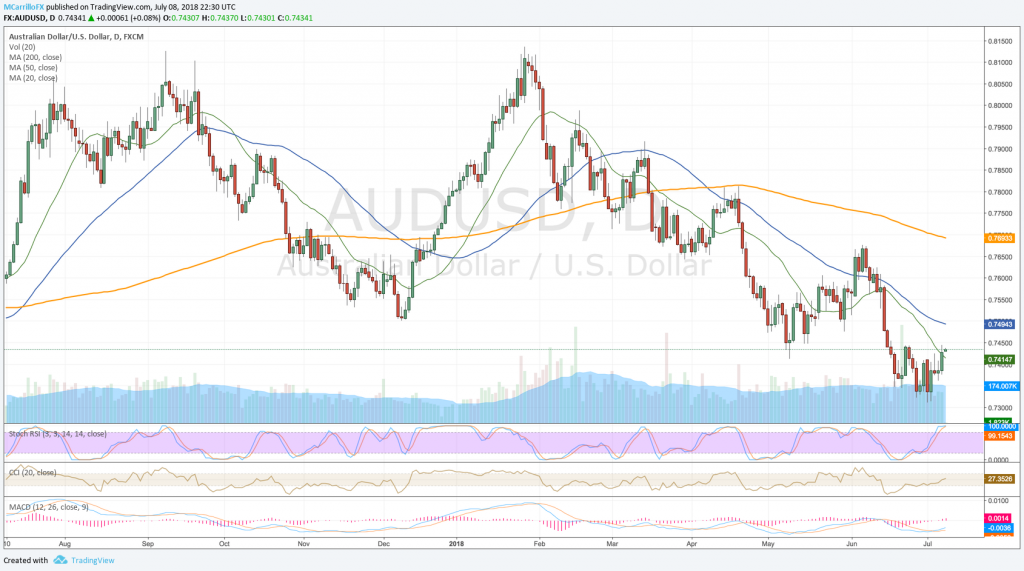
AUDUSD daily chart July 8
The Australian dollar started the week with gains against its American counterpart as the pair is consolidating Friday’s break above the 20-day moving average. AUD/USD is trading 0.10% up at 0.7435.
The Aussie is testing the crucial 0.7440 level. Technical conditions anticipate a healthy upside potential in the middle term.
To the upside, if the pair breaks the 0.7440 area, it will find next resistances at 0.7480 and the 07500 area where the 50-day moving average is lying.

