


GBP/USD deepens its decline and trades at 12-day lows
The British Pound is trading negative for the fourth trading day in a row against the US Dollar as the GBP/USD is extending its rejection from the 50-day moving average level at 1.3020 on August 30.
The GBP/USD is also under pressure following a weak PMI construction index in the United Kingdom and the fears about a no-deal Brexit.
In August, the United Kingdom reported a PMI construction of 52.9, a deeper correction than expected from July’s number of 55.8. Market waited for a decline to just 55.0.
According to the official release from Markit, construction output growth declines to a three-month low in August. The firm highlights the “modest overall rise in construction activity,” also that “suppliers’ delivery times lengthen to the greatest extent since March 2015,” and that “input cost inflation eases to a 25-month low.”
Tim Moore, Associate Director at IHS Markit and author of the IHS Markit/CIPS Construction PMI, comments that “the construction sector slipped back into a slower growth phase in August, with this summer’s catchup effect starting to unwind after projects were delayed by adverse weather at the start of 2018.”
Back to the chart, the GBP/USD is extending declines for the fourth consecutive day on Tuesday. The Sterling is trading 0.25% down in the day at 1.2835 as the pair is trading at its lowest level since August 24.
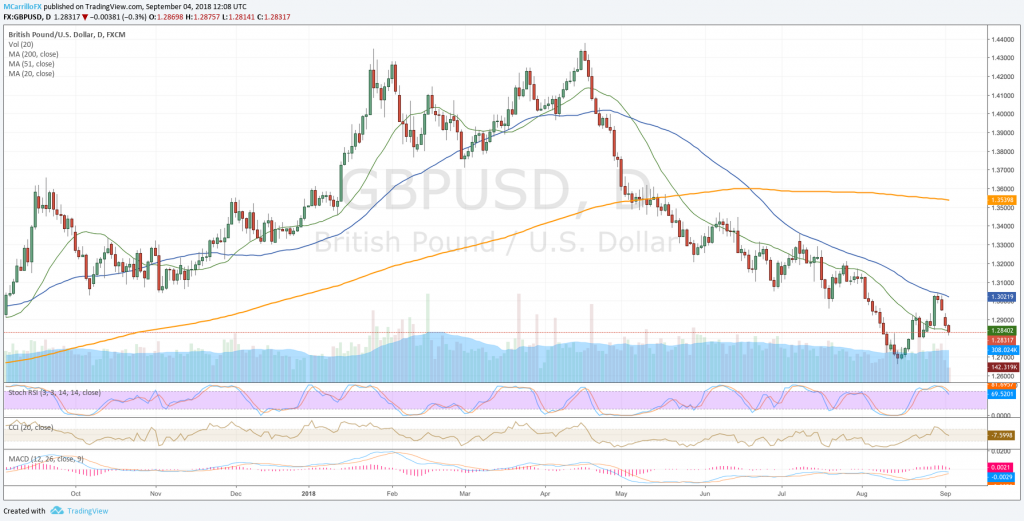
GBPUSD September 4 daily chart
Technical conditions for the GBP/USD are weak as MACD is below its midlines and RSI is signaling the south way. Moving averages are pointing to the south too.
If the pair consolidates declines below the 20-day moving average at 1.2840, it will find immediate support at 1.2800, August 24 low; and then 1.2660, August 15 bottom.
To the upside, if the pair holds above 1.2800, it will turn back and look for the 1.2900 area. Above there, resistances are at the 1.3000 and the 50-day moving average at 1.3020.
