


The week ahead: Inflation and Turkey to make the difference between currencies
Germany, the United Kingdom, and Canada will publish its consumer price indexes the upcoming week and investors are digesting interest rate differentials and possible rate hike changes following surprises in inflation.
Also, Eurozone and Germany will publish gross domestic products while Australia and the United Kingdom will release its unemployment rate.
The collapse of the Turkish lira is also worrying European investors as they are concern about the implications of local banks and how it will spread into banks in the Union. Something similar of what happened in Greece back in the time.
In this framework, it seems the US Dollar will take more profits from the Fed’s monetary policy leadership and interest rate differentials. On Friday, DXY broke above the critical 95.50 area and rallied to trade as high as 96.50; a level where the pair found resistance and then it consolidated gains above 96.00.
The DXY is currently testing the 96.50 area as a first step to return to the 100.00 level. An upbeat consumer price index fueled dollar gains in the United States as inflation excluding food and energy rose 0.2% monthly in July, in line with expectations. On the year, inflation accelerates to 2.4% in July, above 2.3% expected and posted in June.
EUR/USD below 1.1500; watch out for further drops
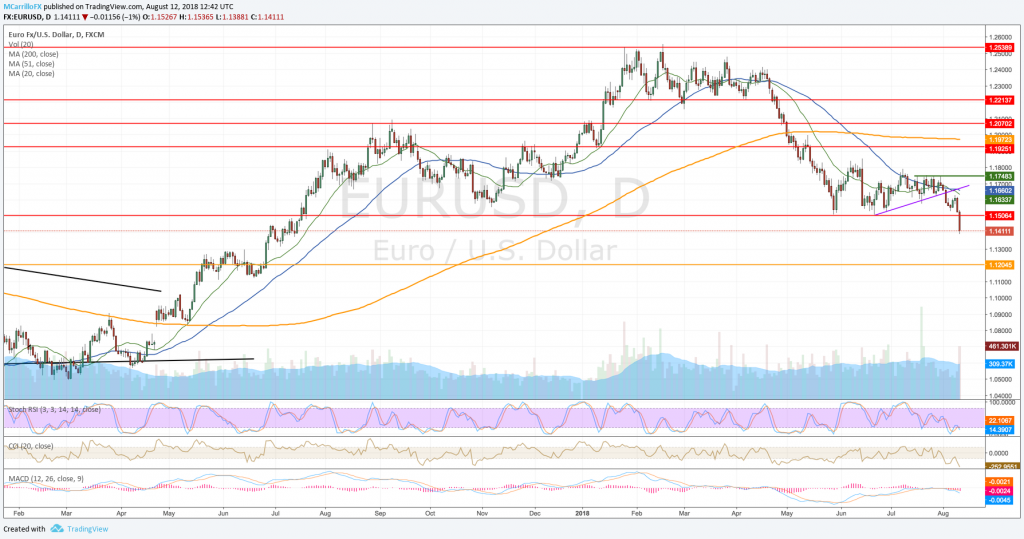
EURUSD daily chart August 12
Euro is trading under pressure as the Dollar is gaining ground across the market. The EUR/USD broke below the 1.1515 area following US CPI data, and it is now trading at 13-month lows at 1.1385.
Technical conditions for the EUR/USD are weak. MACD and RSI are suggesting more room for the downside while moving averages are positioning themselves to the south.
Valeria Bednarik, FXStreet analyst, said in a recent article that the EUR/USD bearish trend is set to prevail and eventual recoveries may be seen as corrective situations. “In the daily chart, the price is developing far below bearish moving averages, with the closest being the 20 SMA, at around 1.1630 now. Technical indicators in this last chart head sharply lower, now nearing oversold territory, and reflecting the strength of sellers.”

