


USD/JPY down to August lows amid Japan GDP
US dollar is trading lower against the Japanese Yen following a better than expected gross domestic product in Japan for the second quarter. USD/JPY is performing an engulfing bearish candle.
Japanese gross domestic product rose 0.5% in the second quarter of 2018, above the 0.3% expected by market and well above the 0.2% decline performed in the first quarter.
Year over year, the GDP rose 1.9% in Japan throughout the second quarter. It was a better than the 1.4% expected by market and well above the 0.6% decline posted in the first three months of the year.
GDP wasn’t the only economic release today in Japan. Domestic corporate goods price index rose 0.5% in July, more than the 0.3% expected by market and the 0.2% posted in June. Year over year, the index rose 3.1% in July, better than the 2.9% expected by market, and 208% posted in the previous month.
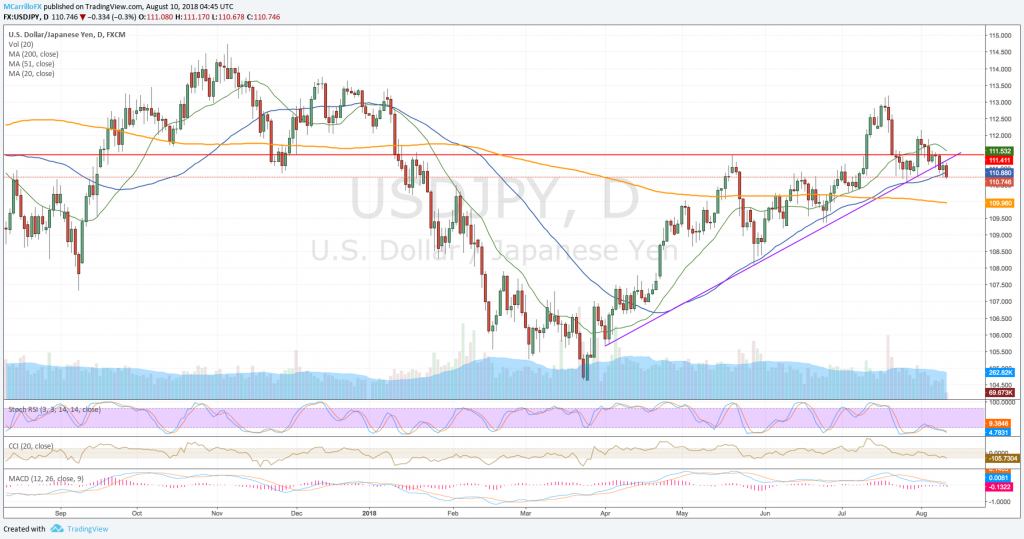
USDJPY daily chart August 10
The USD/JPY is trading 0.32% negative on the day at 110.72. Japanese GDP gave a boost to the yen and the pair is reacting to the downside. The cross is currently performing a bearish engulfing candlestick. That would be a bearish confirmation.
However, technical conditions for the USD/JPY are mixed as moving averages are mixed, while MACD is heading to the downside, and RSI is showing weakness.
A daily close below the 50-day moving average at 110.87, would signal a bull-to-bear change. Below there, check for the 200-day moving average level at 110.00.
According to Omkar Godbole, FXStreet analyst, “the spot has created higher lows along the rising 50-day MA in the last three months, making it a level to beat for the bears.”
To the upside, if the pair recovers the 50-day moving average, it would open the doors for a test at 111.15. Above there, check for the 112.00 area and the 113.00 level.

