


USD/JPY extends declines at the beginning of the week
The US dollar is trading in a weak note against the Japanese Yen at the beginning of the forex week as investors are not willing to risk on the Greenback but buying the Japanese Yen as 10-year JGBs at a six month high.
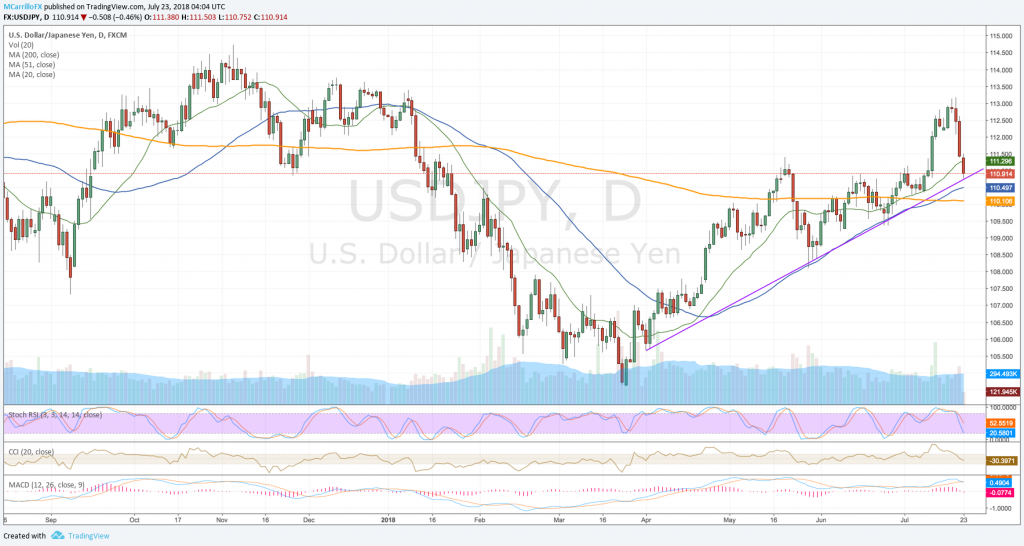
USDJPY daily chart July 23
The USD/JPY is trading negative for the fourth day in a row. Since July 18, the cross has lost around 2%, or 220 pips from 113.75 to today’s fresh lows at 110.95. Currently, the USD/JPY is pricing 0.45% down on the day at 110.90.
Technical conditions for the USD/JPY are deteriorating with MACD and RSI suggesting dovishness. Moving averages are still pointing to the upside, but turning to the south. However, the 50-day moving average is still acting as a support.
After losing ground for three days, investors are looking for a buying zone. However, Barclays published its trade of the week with a shot USD/JPY with a target of 108.10 and a stop loss of 113.40.
According to Barclays, trade war news is supporting the yen as well as the United States and Japan trade talks could weight on risk sentiment. Also, the Bank of Japan will meet next week. At the top of it, Yen shorts are largely unwound.
To the downside, with the pair below the 20-day moving average, USD/JPY is testing dynamic support right at 110.70. Below that, the next natural buying zones would be the 50-day moving average at 110.50 and the 200-day moving average at 110.10.
To the upside, the pair needs to hold above the dynamic support mentioned and a close above the 20-day moving average at 111.30 to spur bulls to buy more.
Above those levels, the USD/JPY would find next resistances at 111.50, 112.00 and 113.00. Then, the July 19 high at 113.20 would be the ultimate resistance.
