


The Doji Candle in Technical Analysis
The Doji pattern belongs to the Japanese approach to technical analysis, and it is a concept appreciated by all traders that use a candlesticks chart. The beauty of it is that it is made of a single candlestick.
Moreover, it is one of the most mysterious patterns of all the Japanese candlesticks patterns we know today. This is explained by the fact that it shows both continuation and reversal conditions, leaving traders expecting for the market’s breakout before deciding to go long or short.
Another exciting characteristic of the Doji pattern is that when combined with other Japanese candlestick formations, it strengthens them and give traders more confidence about the next market direction.
Defining the Doji Candle
Any Japanese candlestick has a real body (the difference between the opening and closing prices) and an upper and lower shadow. When the closing price is much bigger than the opening one, the candle is bullish, as the market advances.
A bearish candlestick forms when the closing price is lower than the opening one, showing a market that declines.
Well, with the Doji candle, the real body is neither bullish nor bearish. Is neutral. Neither bulls nor bears win this fight, leaving things uncertain.
This is the original concept of the Doji pattern. However, today’s financial markets evolved to the point that execution allows for patterns’ alteration.
Nowadays, the FX market has five-digit quotations on most currency pairs, making it almost impossible to see similar prices for the opening and closing levels of a candlestick.
The Doji Candle in Today’s FX Market
Today’s traders must be flexible when looking for and interpreting the Doji candle. Flexibility means that traders allow a bit of a difference between the opening and closing prices in a candlestick.
Below is the recent daily chart on the EURUSD pair. It shows three Doji candles, and, from left to right, they have a different interpretation.
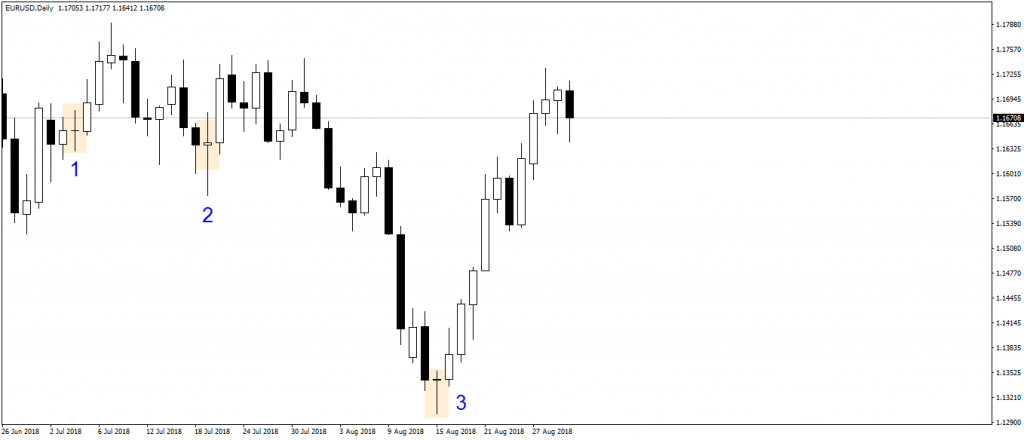
The first Doji pattern is a continuation pattern. The market stops for a while (one candlestick), before resuming the bullish trend.
In the second instance, the Doji reverses a small bearish trend. For the next ten trading days (two full trading weeks), the market wasn’t able to break below the Doji pattern. It didn’t turn out to be a Doji as a reversal pattern, but it definitely held the bears for quite some time.
Finally, the last Doji is a true reversal pattern. Not only that is forms at the absolute bottom of a bearish trend, but it is the middle candlestick part of another bullish reversal pattern: a morning star.
Conclusion
Just looking for Doji candlesticks is enough to learn about the price action and the future market direction. For such a simple pattern, made of just a single candlestick, the Doji has powerful implications, mainly if it forms on a significant timeframe.

