Explaining RSI Divergences
Oscillators are indicators applied at the bottom of a chart, in a separate window, and traders use them to forecast future prices. In contrast with trend indicators, oscillators mainly show market reversals.
The idea behind an oscillator is that it uses past data to project a value corresponding to the current candle. Based on a mathematical formula, it calculates the current value using multiple periods from the past.
Because of that, traders always stick to what the oscillator shows, and not to what the current price of a currency pair does. When the two differ, the market is said to be in a divergence.
RSI Divergences
Since the Personal Computer (PC) became popular, traders used the computing power to apply complicated concepts to technical analysis. The resulting indicators stood the test of time to become the basis of the new technical analysis wave.
Belonging to pre-2000 technical analysis concepts, the RSI or the Relative Strength Index is an oscillator extremely popular among traders. It shows two things:
- overbought and oversold levels
- divergences with the price
The focus of this article is on RSI divergences, what they are and how to trade them. As usual, we’ll use practical examples to illustrate the concept.

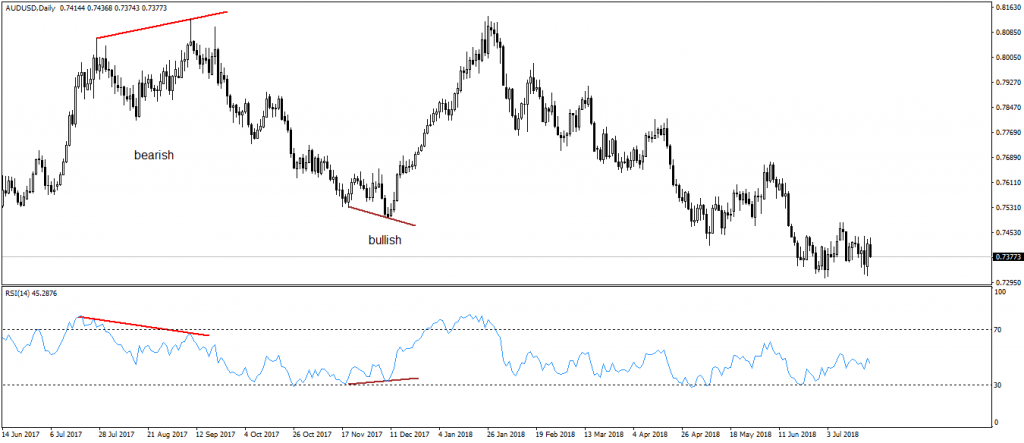
The chart above shows the recent AUDUSD daily price action. And, below, in the small window, the RSI(14) “follows” the price.
As an explanation, the 14 number stands for the periods used to project the RSI current value. Typically applied to the closing prices, it uses the ones of the last fourteen periods (in this case, days) to project the RSI value.
A divergence forms when the RSI doesn’t follow the price trails. And, because it considers multiple periods, traders stay with what the RSI does.
The focus sits on the potential reversals. As such, when the RSI doesn’t confirm a second higher high or lower low, a possible reversal appears.
Called divergences, they are bullish and bearish. In a bullish divergence, the price forms two lower lows, but the RSI doesn’t make the second one.
And, in a bearish divergence, the oscillator fails to confirm the second higher high. As a consequence, traders go short after a bearish divergence and long after a bullish one.
Conclusion
Trading bullish and bearish divergences requires an in-depth trading strategy that contains a stop-loss order and a take profit. In the currency market, the price has the power to remain in a divergent mode more than the trader can stay solvent. Hence, caution is needed before trading with RSI divergences.


