


The Japanese Approach to Technical Analysis
While most traders accredit technical analysis patterns to the birth of the United States stock market, the reality tells us something else the Japanese approach is as important. In fact, most retail traders today use more Japanese concepts rather than Western ones. And, for good reasons.
All traders heard of candlesticks charts. Such charts successfully replaced the old-fashion bars charts belonging to the Western approach to technical analysis.
A candlestick not only covers the opening and closing prices but also uses the information in between. For instance, a candlestick on the daily chart shows the opening price, the closing, but also the highest and lowest values, and what happened in between.
What is a Candlestick?
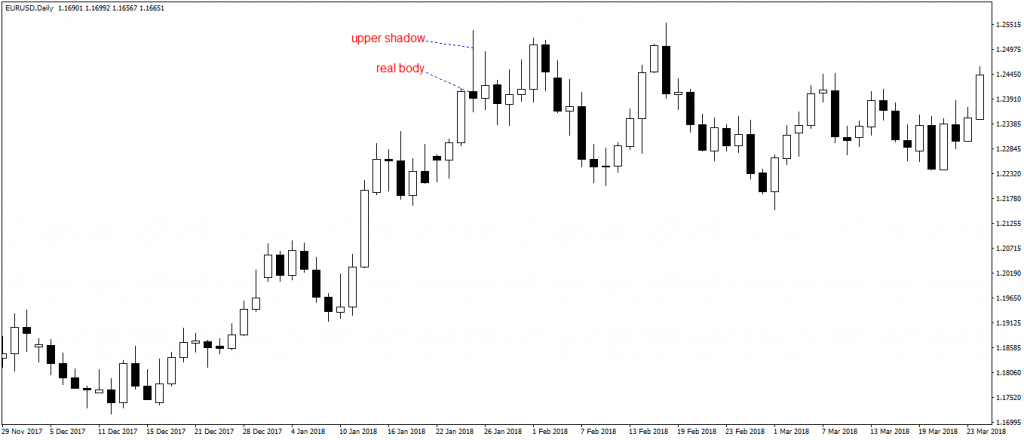
A candlestick has the following parts:
- body
- upper shadow
- lower shadow
The body of a candlestick is either bullish or bearish. Also called the real body, its color reflects the market’s direction.
If the opening price is bigger the closing one, the candle is bearish. Typically, red, it can also have any kind of color that suits the trader’s preferences. Just like below.
The candlesticks chart above has white candlesticks showing bullish price action and black ones for bearish price action. When the closing price is bigger than the opening one, the market forms a bullish or white real body.
The shadows, upper and lower, ore often responsible for the candlesticks’ nature. For instance, a candle like the one above shows bearish conditions ahead, as the upper shadow shows downside pressure at the closing of the candle.
Also called a shooting star pattern, or inverted hammer, its main characteristic is a long upper shadow and a small real body. The color of the real-body doesn’t matter; it could be bullish or bearish. The focus, instead, remains with the upper shadow.
Candlestick Patterns
Together with the real bodies, upper and lower shadows gave birth to the so-called Japanese candlesticks patterns. The most representatives are:
- Hammer or shooting star (as illustrated above)
- Bullish and bearish engulfing
- Morning and evening star
- The Doji candles
A thing to remember and a significant advantage when using the Japanese candlesticks patterns is the fact that they are far less time-consuming than the classic Western patterns. In fact, the shooting star or the inverted hammer as shown in this article only takes one candlestick to reverse a trend.
Conclusion
The candlesticks charts and the candlesticks patterns are a major contribution to technical analysis. Western world traders quickly recognized their value and adopted them wholeheartedly.

