


Bitcoin clings to 7,400, technicals favor the upside
$100 at a time, bitcoin is gaining ground against all the odds as investors are turning their eyes back to the king of cryptocurrencies. Technical conditions are now bullish, and the scoop is finally for more gains for the first time since January.
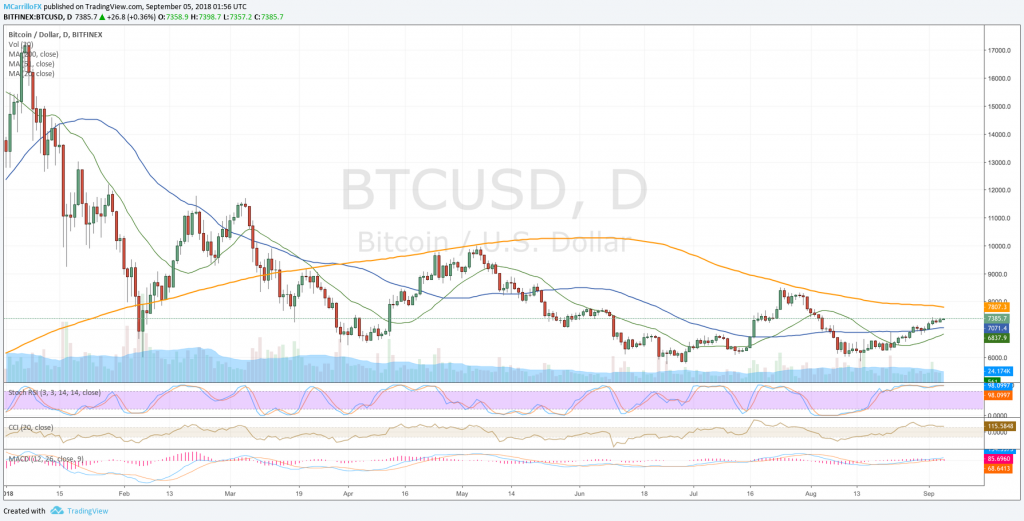
BTCUSD daily chart September 4
BTC/USD is trading positive on Wednesday for the fifth day in the last six as the pair consolidated support at 6,880 on the last days of August and it built a leg for a new bullish move that drove BTC/USD to price above the 7,400 level.
Currently, BTC/USD is trading 0.40% positive at 7,390 on Wednesday. Since the August 14 bottom of 5,860, the cross has gained 26% to trade as high as 7,430 this week.
CoinDesk analyst Omkar Godbole affirms that bitcoin is adding indicators signaling a long-term bullish reversal. “The latest to join the list is the MACD histogram, which has moved above zero – turned bullish – for the first time since January. The MACD, which oscillates above and below the zero line, is one of the most popular technical indicators used to determine a trend’s reversal and momentum.”
“So,” Godbole adds, “it seems safe to say that the outlook as per the weekly chart is bullish. As a result, BTC could explore the upside towards the July highs above $8,500 in the next few weeks.”
With BTC/USD trading at 7,390, if the pair extends gains, it will face immediate resistance at the 200-day moving average at 7,800 level. Above there, 8,250 and July’s highs at 8,500.
To the downside, with a rejection of the 7,400 area, the pair will face support at the 50-day moving average at 7,070, and 6,840. Below there, please see for the super support below the 6,000 area.

