


Ethereum squashed between 20 and 50 days moving averages
Ethereum, the second cryptocurrency by market volume is trading in a narrow range between 459.00 and 474.00 significant moving averages levels. ETH/USD is trading also in a symmetrical triangle with the break expected to happen in the next days.
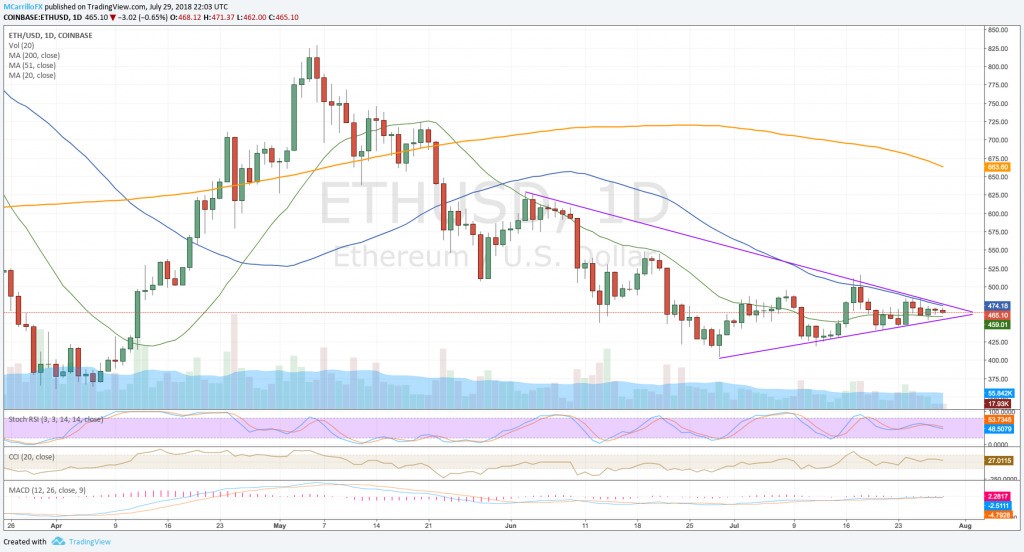
ETHUSD daily chart July 29
ETH/USD is trading negative for the fourth day in the last five as the pair was unable to break above the 484.00 area on July 24, 25 and 26. Then, the cross started to trade sideways.
Currently, Ethereum is trading 0.65% down on the day against the US dollar at 465.10. The pair is fighting to clear up a very dense area of short and long-term resistance levels at $467.
On the big picture, the pair is trading inside a triangle coming from June 29 for the bottom and June 3 on the top. Also, the 20-day moving average is supporting the cross at 459.00, while the 50-day moving average is capping the upside at 474.15.
Yohay Elam, FXStreet analysts, comments that “this concentration explains the stickiness of the price. An upside move could slightly be slowed down at $477 which is the confluence of the Fibonacci 23.6% one-week, the BB 4h-Upper, and the Pivot Point one-day Resistance 2.”
Technical conditions for the ETH/USD are neutral to bearish as moving averages are pointing to the south while the MACD is on the bearish frame and RSI are falling to the midline.
As for the upside, 50-day moving average at 474.15 is the immediate resistance, and 478.00 is the upper line of the triangle. Above there, 515.75, July 18 high, and 545.40 June 19 are the levels to watch.
To the downside, 20-day moving average at 459.00 is the first support. Then, 442.00, July 20 high; 418.90, July 12 high; and 407.30, June 29, are the most significant levels to watch.

