


U.K. GDP rose 0.3% in May; industrial production disappoints
The United Kingdom reported an increase on its gross domestic product of 0.3% in the last three months to May, a number in line of expectations. On the other side, Industrial and manufacturing production published weak numbers. The Sterling is on a recovery phase.
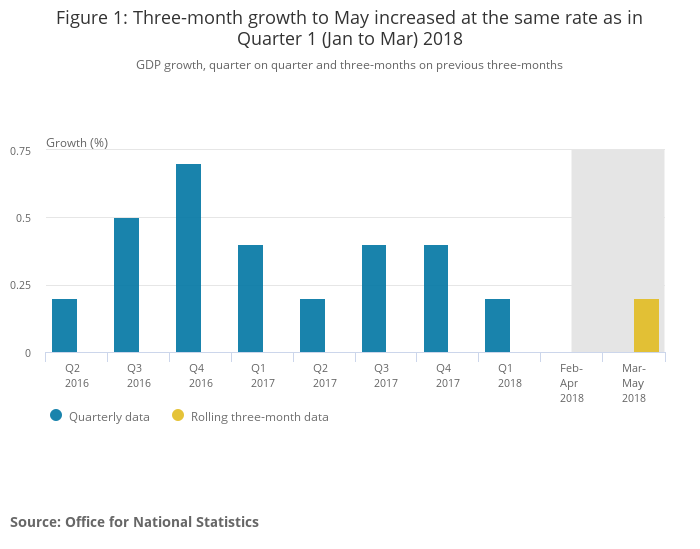
Three-month growth to May increased at the same rate as in Quarter 1 (Jan to Mar) 2018
The gross domestic product growth to a rate of 0.3% in the last three months to May in the United Kingdom according to the Office for National Statistics in London. The number was in line of market’s expectations and an acceleration from the three-month to April flat number.
Industrial production in Britain declined 0.4% in May, extending April’s drop of 1.0%. The decline was unexpected as the market waited for a 0.5% increase for the fifth month of the year.
Year over year, Industrial production rose 0.8% in May, well below the 1.9% increase expected by market and a slowdown from April’s number of 1.6%.
According to the National Statistics press release, the decline was “led by falls in energy supply of 3.2% and mining and quarrying of 4.6%.”
On the manufacturing sector, its production rose 0.4% in May, less than the 0.9% expected but a recovery after the 1.3% decline posted on April.
Year over year, manufacturing production rose 1.1% in May, an acceleration from the 0.9% figure of April, but a number that came short of the 1.9% expected by market.
Finally, the UK reported a narrow trade deficit than expected in May at £-3.491B, less than £-4.335B in April. The UK is inside a political turmoil and even the trade war between the United States and the world.
GBP/USD reacted negative to UK Data, but recovery is on the ground
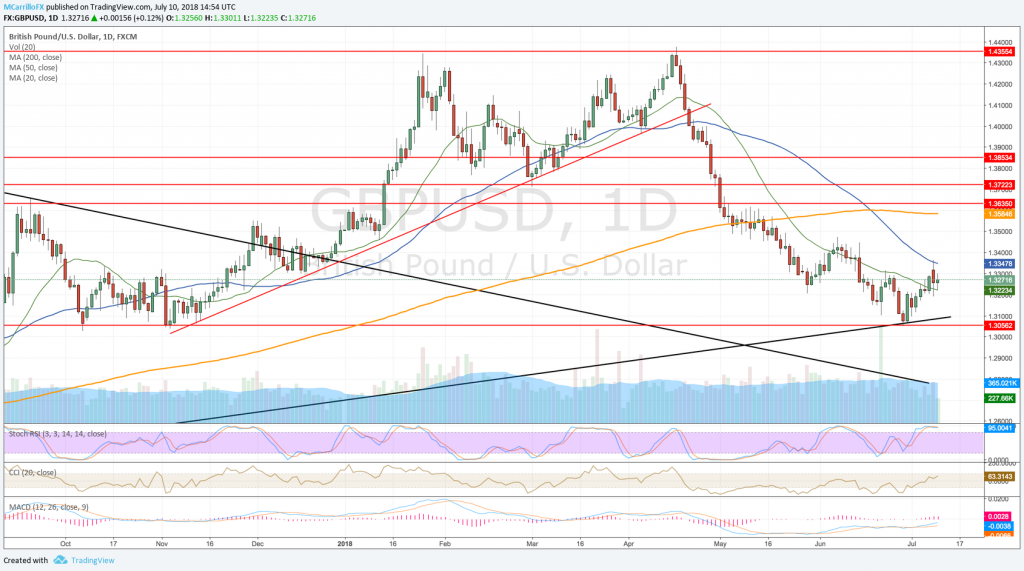
GBPUSD daily chart July 10
The British Pound reacted with losses following the UK GDP and industrial production release earlier in the morning. GB^/USD is currently trading 0.10% positive on the day at1.3270.
On the daily chart, GBP/USD looks overbought and contained by the 50-day moving average as it was tested on Monday. On the other side, cable is being supported by the 20-day moving average at 1.3220.
The big picture shows that GBP/USD is on recovery phase from 1.3050. Momentum is signaling bullish potential is healthy.

