


UK PMI services signals more expansion; Pound up
The service sector in the United Kingdom is improving its business as the latest PMI services index jumped to 55.1 in June, its strongest activity index since October 2017 and well above 54.0 expected by the market. The news highlighted that new work jumped to its fastest pace for 13 months.
According to Markit, “UK service providers indicated the fastest expansion of business activity for eight months in June, which continued the recovery in growth seen since March’s snow-related disruption. The latest upturn in service sector output was supported by the strongest increase in new work since May 2017.”
Cited in the press release, Duncan Brock, Group Director at the Chartered Institute of Procurement & Supply, said: “Exceeding expectations the sector ended on a positive note at the end of the second quarter, buoyed up by the fastest rise in new orders in over a year and the strongest overall performance since last October.”
GBP/USD trades at 1-week high after UK PMI services
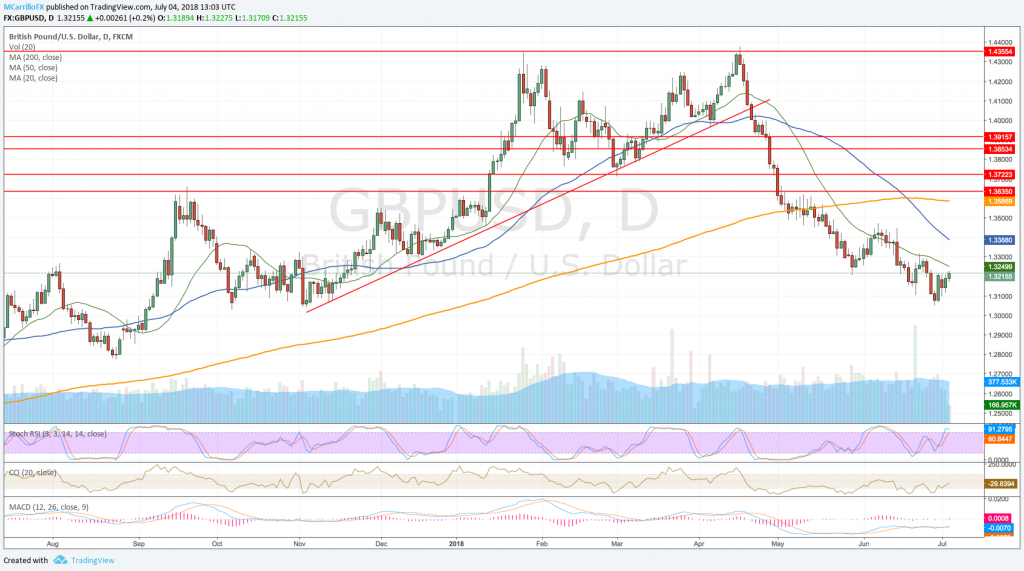
GBPUSD daily chart July 4
The British Pound is reacting positively following the news as investors see an upbeat PMI service as a more robust sector that will lead the Bank of England for interest rate hikes in the middle and long-term.
GBP/USD is currently trading 0.20% positive on the day at 1.3215. The pair is pricing at intra-day highs as it is fighting to trade above the 1.3200 level.
The British pound is currently in a recovery phase following a bounce from 1.3050 performed on June 28. In the last week, the GBP/USD recovered 170 pips, or 1.30%, from lows, but it remains subdued by the 20-day moving average of 1.3250.
Technically, the British Pound looks overbought in the 4-hour chart, but bullishness seems healthy. A sustained move above the 1.3215 would trigger short covering move that would provide enough fuel to the pair gets above the 1.3300 area.
However, the 200-period moving average in the 4-hour chart stays at the 1.3300, a level that has been respected by the GBP/USD since April 2018. The 200-period MA line even rejected the cable on June 14.
On the bigger picture, moving averages are aligned to the south and, while pair looks overbought, MACD and is bearish.
To the upside, a break above the 20-day moving average would suggest an acceleration to June 22 high of 1.3315. Then, the 50-day moving average is waiting for the cross at 1.3390. 1.3500 is the frontier to watch for the bullish case.
On the downside, the pair needs a close below the 1.3050 to provide bears with reasons to sell even more. The cross looks negative, so below there, 1.3000 is the critical level to watch. Then, 1.2790.
